Episode 43 - Draw Me a Red Line Around …
You can send satellite imagery to an LLM, ask it to "draw a red box around every swimming pool," and then extract those red boxes as vector features. No GPU required. No domain-specific training. Just an API call and some image processing.
Prologue
It's raining. Not Portland's usual drizzle, actual legit rain! The kind of weather that makes you want to stay inside and build things. (Editor’s Note: On publication day, it is sunny and nice outside and I should go out there!)
So that's what I did.
In Episode 42 last week, I walked through three ways to classify imagery in ArcGIS using AI: domain-specific models, Segment Anything, and Vision Language Models (VLMs). This episode is actually based on the live demo from my tech webinar last week, where we dove deeper into VLMs.
TL;DR - You can send satellite imagery to an LLM, ask it to "draw a red box around every swimming pool," and then extract those red boxes as vector features. No GPU required. No domain-specific training. Just an API call and some image processing.
Redlineologue
Here's the core idea: Vision Language Models—or VLMs (Esri calls this "Vision Language Context" in their tooling) aren't just good at describing what's in an image. Some of them can modify the image and return it to you.
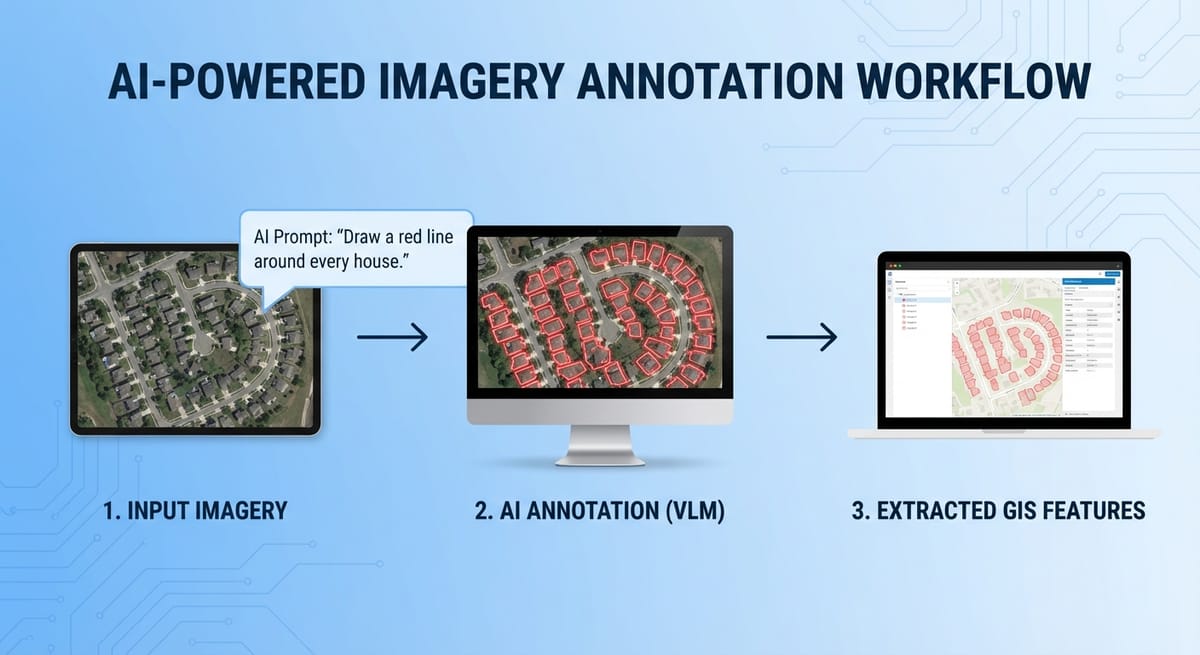
Google's Gemini 3.0 Pro—codenamed "Nano Banana Pro," because apparently someone at Google lost a bet—can take an image as input and return a modified image as output (really well). So I uploaded a screenshot of a neighborhood and typed: "Draw a red line around every house in this satellite image."

That worked, and this is a process we can automate! The workflow is pretty straightforward: Screenshot of web map → n8n webhook → Gemini API → return annotated image. I use this type of pattern frequently in my proof-of-concept applications (aka disposable apps) (using n8n as the backend).
The ArcGIS JavaScript API includes a media layer that lets you display any image on a map within a specific extent (a.k.a. Geo-referencing an image in a web map!). After our n8n webhook returns the image, we can add it as a media layer to our webmap at the exact location where we took the screenshot.

In the webinar, we tried swimming pools, lakes, single-family homes, and solar panels. Solar panels were... less successful.
But honestly, I'm only average at spotting solar panels myself, so I can't judge too harshly.)

When Gemini draws those red boxes, it's just returning a PNG. Those are just red lines in an image; they are not features that I can click on or interact with. So I wondered: could I use standard GIS raster processing tools to extract the red lines and convert them into features?
Yes. Yes, I can.
As usual, I asked Claude to write some JavaScript that identifies red pixels by checking if the red channel dominates, finds contiguous regions of red, calculates their bounding boxes, converts them from image coordinates to real-world coordinates, and adds some graphics to the map!
And suddenly, I have clickable features a.k.a. real polygons extracted from an AI-generated annotation. In the browser. No server-side processing. No GPU.

Is it perfect? No. Sometimes the image has a red tint that is not visible but is enough to confuse my pixel-detection algorithm. I got phantom polygons in areas that weren't actually marked. The fix is better color detection, or better yet, using ArcGIS's proper raster analytics tools.
For some use cases, imperfect and fast beats perfect and slow. Imagine drone imagery right after a natural disaster. You need to identify damaged structures immediately. There isn’t an existing model trained with your specific drone sensor, and there isn’t time to train a domain-specific model. But you can send images to an API and say, "draw a red box around any building that looks damaged," and start getting answers in seconds.
You don’t have to stop with this, though; you could use the LLM to bootstrap a more accurate model. Start with the LLM for a quick first pass to generate candidate features; then QC those results and use them as training data to fine-tune a domain-specific model for higher accuracy.
This whole approach—ask an LLM to draw on an image, then use standard image processing to extract those annotations as features—feels like a pattern that's going to show up everywhere.
Newsologue
- My favorite physical AI recording device, Limitless, was acquired by Meta last week. Which, I don’t like. It sounds like they are shutting it down, they have updated privacy policies and generally made it sound like the only people who got a good deal here were the founders (and maybe the VCs). I really hope they got what they wanted, now I’m looking for a new device.
- OpenAI released a new study about AI use in enterprises. They found that the most advanced AI users save something like 8-10 hours per week. For me, I feel like it is more than that. I have built two production ready applications this week, from scratch, and I’m happy with the results.
- Totally unrelated to GIS, but this startup, Quilter.ai, used AI to design an entire linux computer (the hardware) from scratch, and apparently no human had to alter the design. That is very cool, and is a really interesting technique. I wonder if there are other things that AI could do that are similar, like GeoDesign?
Weekend Project: Building a GIS Apparel Brand with Claude as CEO
Ever wonder what happens when you give an AI full autonomy over a business? I'm finding out in real-time.
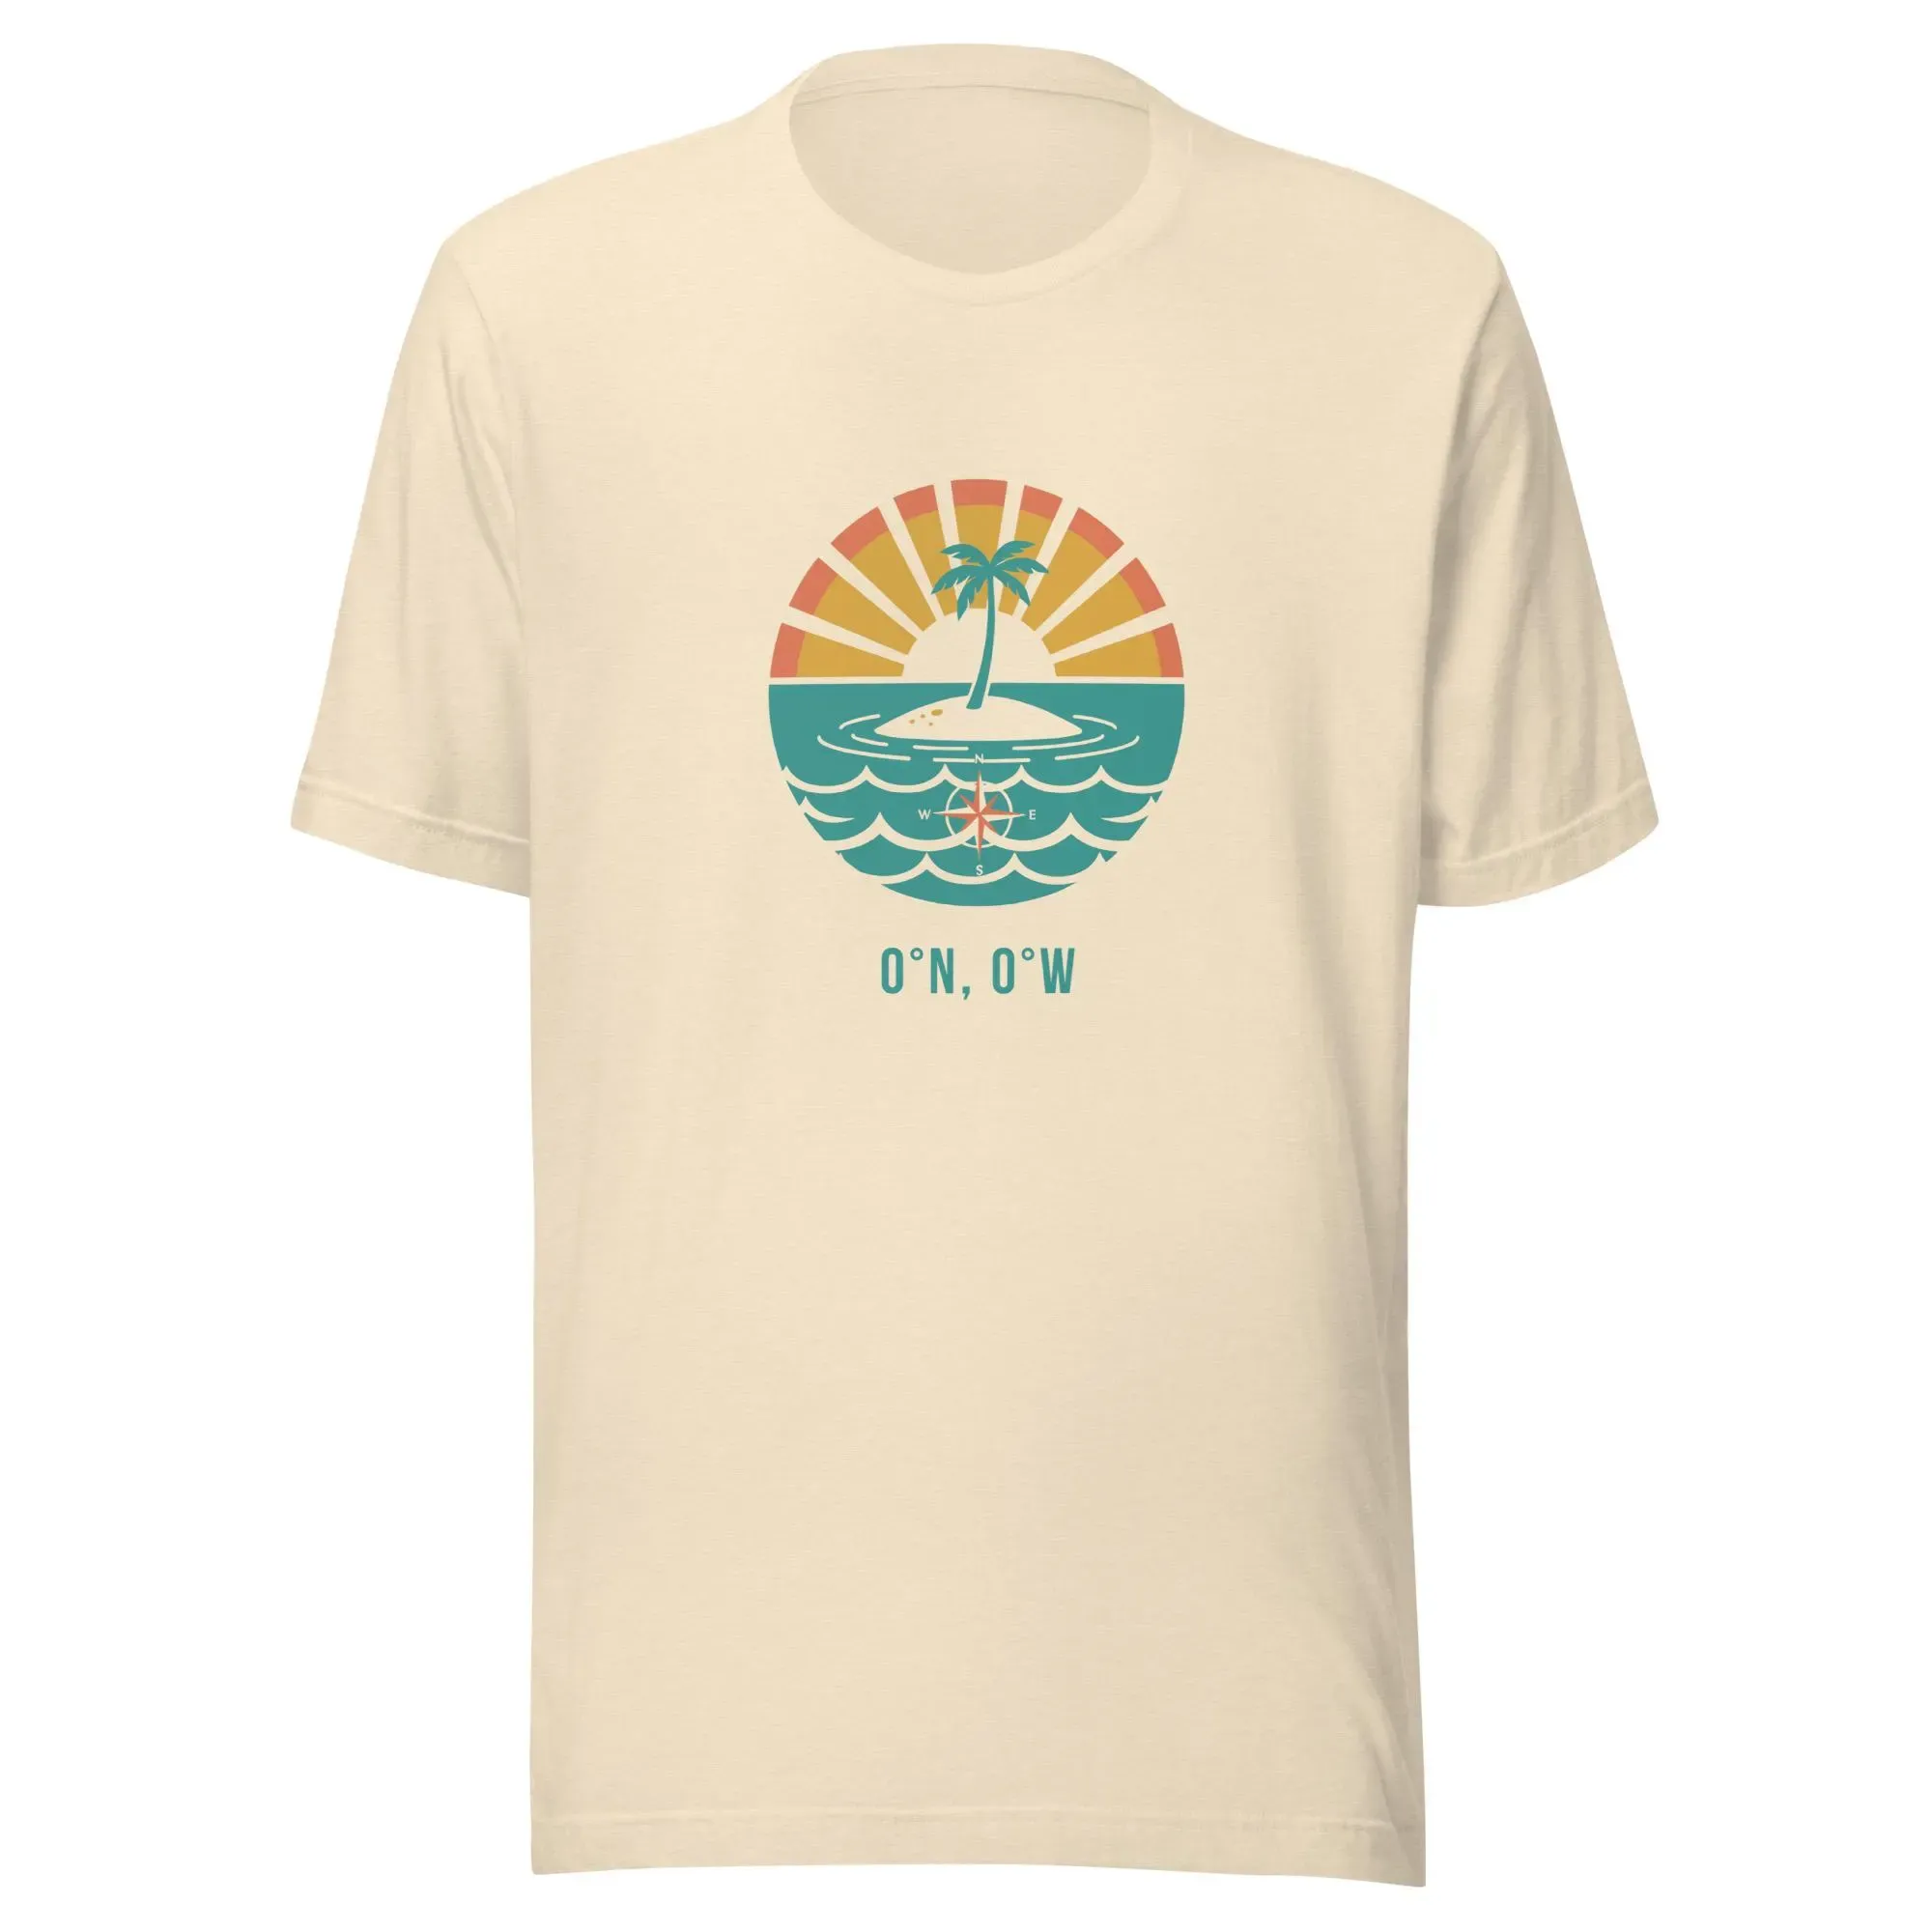
Recently, Claude and I launched Null Island Co: GIS-themed shirts for people who know where 0°, 0° is. Claude makes every strategic decision (pricing, design direction, marketing strategy), I execute the technical work (n8n workflows, Boxy SVG, Etsy setup).
(I'll write up the experience at some point. Spoiler: Claude is a demanding but effective boss.)
Epilogue
Claude wrote this episode using my livestream/webinar this week as the input. Then I spent a while editing it, and then Holly edited it, and then I edited again (I’m not sure it saved me time). I did provide some guidance on the original prompt. I’ve been working on building a series of Claude agents that are better at writing like me.
Claude also built the n8n workflows and the JavaScript for red pixel extraction. It's Claude all the way down, which feels appropriate for an episode about using LLMs to do things they weren't explicitly trained to do.