Episode 50 - Building GeoScribble
Join me while I build GeoScribble, a draw the country from memory app!
Prologue
Last week in Episode 49, I talked about my three-step process for building apps with AI: Think, Engage, Test. This week, I have an example of what that looks like in practice! Everything from starting at “I have no idea what I’m actually building” to having AI test the game that I built with AI.
This started, as so many bad decisions do, with me scrolling LinkedIn on a Saturday morning. I saw a post from Courtney Yatteau showing off a fun example of using AI to generate color schemes for a map. I thought, I want to do something fun too! Now… what should I do?
I normally start this process with an idea, but this time I was starting way behind. All of my friends were asleep, so I sat down with Claude Desktop, and we started talking.
If you want to play the app, I'll wait: https://geoscribble.christophermoravec.com/
Wanderlogue
Think
This brainstorming session was a journey, and not the inspirational kind with background music, the “we took seventeen wrong turns but eventually found the highway” kind.
I started with a vague instinct: something about real geography and transforming it. Claude ran with it, generating ideas such as Tolkien-ifying satellite imagery, video game map aesthetics, and historical map styles. When I asked for even weirder ideas, Claude delivered:
- Cryptid Sighting Generator – Click anywhere and get a fresh local monster 👺
- Sound of Place – Generate ambient soundscapes from land cover 👂
- What's Buried Here? – Fictional archaeology at any coordinates 🏴☠️
Those were fun-ish with good energy, but nothing really clicked with me. We briefly discussed a Fake Historical Plaque Generator ("ON THIS SITE IN 1987, A MAN BRIEFLY THOUGHT HE RECOGNIZED SOMEONE BUT WAS MISTAKEN"). But that wasn't it either. Maybe a game?
A few more pivots, backtracks, and dead-ends later, I don't remember if it was me or Claude (okay, it was Claude), we came up with "Wordle energy," from which came "Flash Memory," which I refined with the final masterstroke: "show three countries and their names for 5 seconds, then draw this one for 20 seconds."
GeoScribble was born.
Engage
Our brainstorming session concluded with Claude drafting a design, and I moved on to Claude Code. I gave it the design, a rough outline of what I wanted, and asked it to challenge my assumptions before writing any code.
The plan was solid: React frontend, HTML Canvas for drawing, date-based seeded randomness so everyone gets the same puzzle each day (no backend needed!), and AI scoring to compare your drawing to the real shape.
Roughly 30 minutes later, Claude had finished, and I had a working version of the app.
I spent a while working on the drawing part to try to make it feel… "better," using a library called rough.js to add a hand-drawn wobble (I wanted it to look like a sketch, not just cold lines on a computer screen), but I ended up pulling it out because it was causing performance problems with my updated scoring system. Sometimes simpler is better.
Test
I decided to use Claude in Chrome a bit more for this project, so I had it handle much of the initial testing. I didn't think this was actually going to work—after all, my previous experiments trying to get Claude to manipulate computers or the browser were mixed at best. It just fails to understand some things.
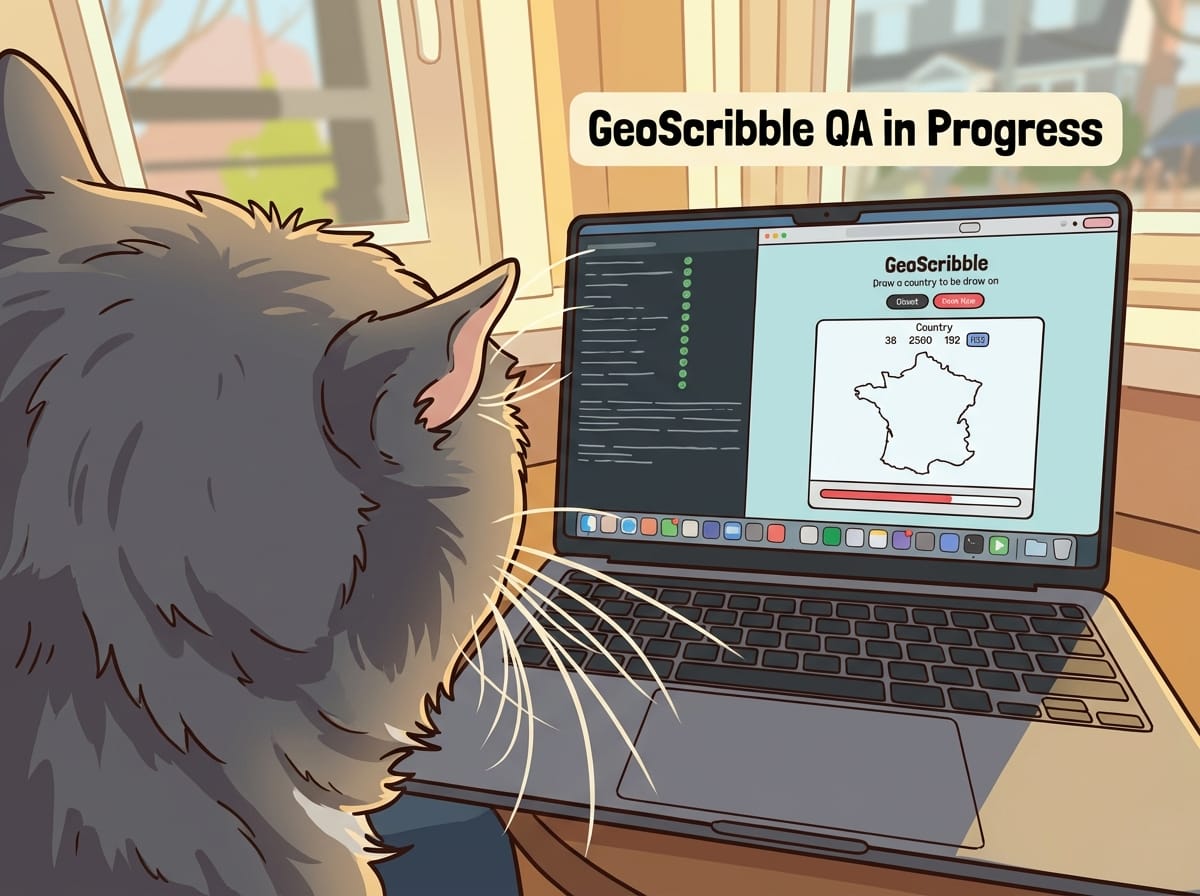
A short video showing Claude drawing a country. Sorry for the shakes... I thought it was a good idea to use my phone to record the screen instead of.. you know.. recording the screen.
But it can draw! (I was very wrong; it has gotten much better) It should have gotten much more than an F; we were still working on the scoring system at that point.
An AI drawing a country from memory to test my country-drawing-from-memory game. We live in the future, and it's weird.
Some Lessons Learned
I started out thinking I wanted AI to compare the user's drawing to the reference drawing, but I realized we could do something simpler: math.
Sometimes the AI-shaped hole in your project isn't actually AI-shaped. AI is wonderful for many tasks, but you don't have to use it for everything. In this case, I used AI to generate the code for the algorithm—but the algorithm itself is just geometry. Faster, free, works offline.
Claude and I created a debug page that shows how the score is calculated. After you play, you can click "See why I got this score" to see the whole breakdown:
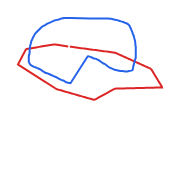
Normalize Position and Scale – Make both shapes roughly the same size by scaling them to the same center and dimensions
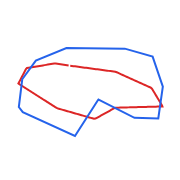
Resample – Convert the two shapes into 100 evenly-spaced points around each shape
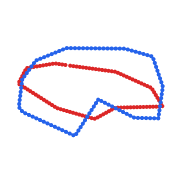
Align – Figure out where to start by finding the closest starting pair. We are looking for the red and blue points that are closest, we assume this is a good place to start.
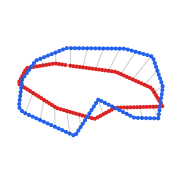
Compute Distance – Calculate the distance between each pair of matching points, starting from the points found in the previous step, this becomes the score!

The sharing was also a pain. I wanted to copy and paste a URL on LinkedIn that would show my scribble and score—but not give away the country. This meant saving the drawing to a server and using OpenGraph tags. Claude managed that mostly fine.
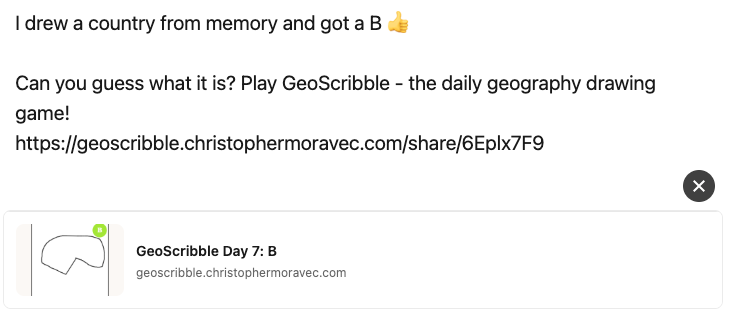
The harder part? Every operating system handles the share sheet differently. On Windows, there isn't even a "copy." So I ended up creating a special version for desktop users that just copies to the clipboard.
What a crazy world we live in that I can spend an afternoon and bring an application into the world that didn't exist.
Newsologue
- Claude now has “Tasks” which are really fancy Todo lists that work across agents and sessions, making them much more resilient to things like crashes or when you run out of tokens in your session (this happens to me, frequently)
- Anthropic has extended MCPs with UI. An MCP is a way for Claude to interact with another application. Adding a UI means that within the Claude app, not only can it take action, but the results can be easily displayed to you without you having to switch applications.
- Google is adding Gemini directly into Chrome. I’m skeptical, but as you saw in this episode, the models are getting way better at taking direct action in the browser.
Epilogue
I wrote this post. It started as voice memos and notes from Claude that I had it write down during the building. Then Claude and I worked on a draft, and I rewrote it (very slowly, I was easily distracted). Claude edited, then Holly edited.