Episode 10 - What Your Content Looks Like in Embedding Space
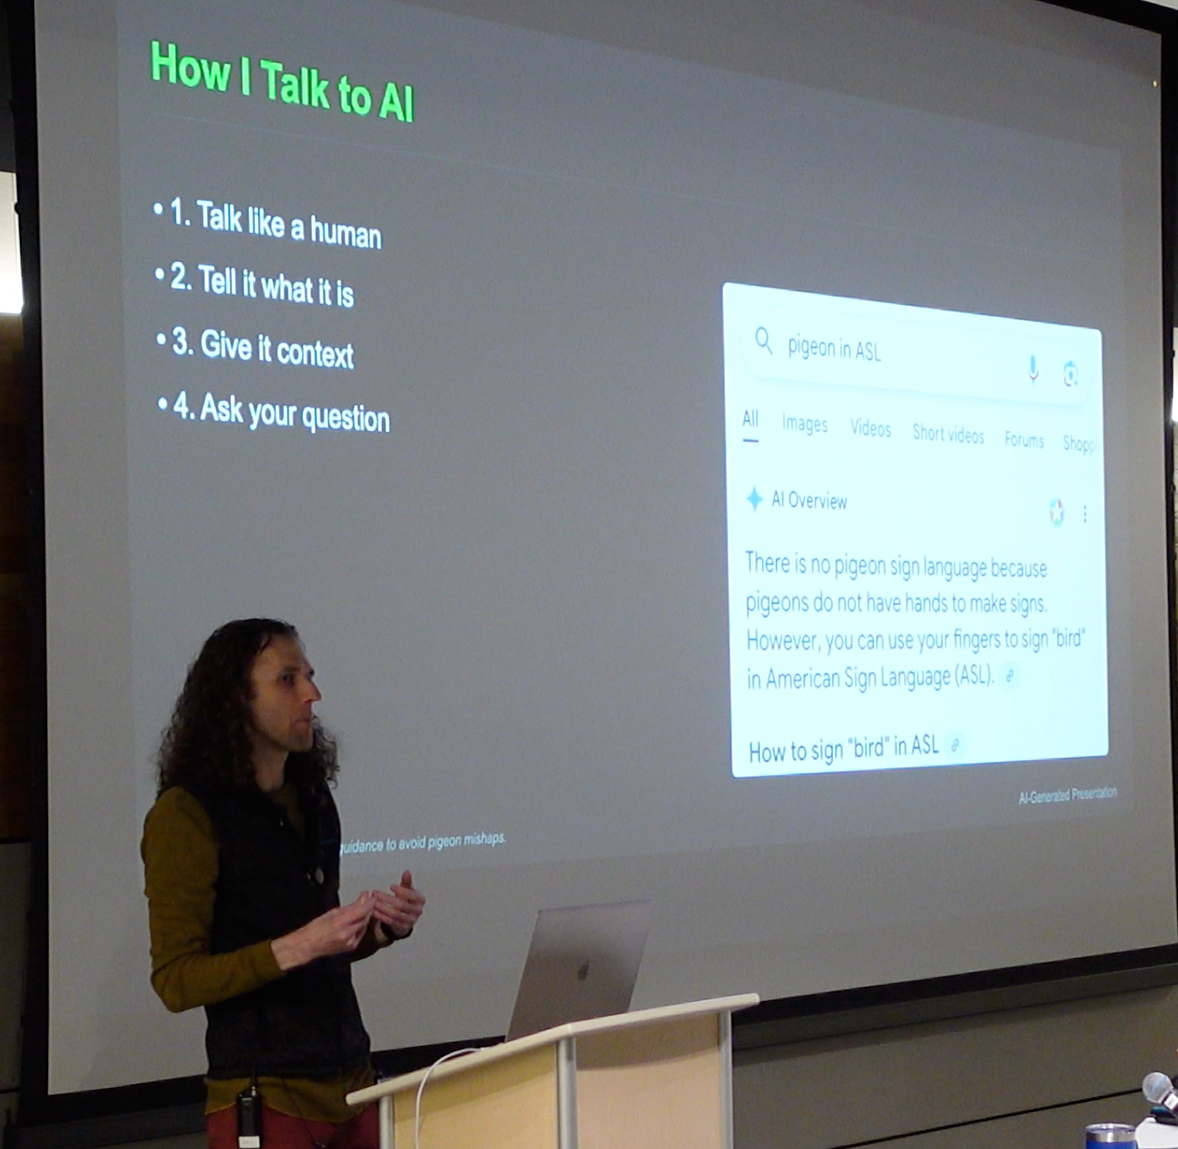
Yesterday, April 24th, 2025, I gave the closing keynote at the GIS in Action conference in Portland, OR. It was a blast, even if my AI Powered slides were not on their best game.
Don't Panic! It's just AI!
This is part 3 of 4 posts on building an AI-Powered Summaraizer tool:
- Episode 8 - One Summary to Rule Them All
- Episode 9 - How to Find Content Like You Find Places on a Map
- Episode 10 - What Your Content Looks Like in Embedding Space (this one!)
- Episode 11 - the Final Chunkdown - Building Smarter Summaries
Prologue
(Announcer Voice) In last week’s episode, we saw how embeddings can turn blog summaries into vectors. Once we have those vectors, we can do things like find all the summaries that are semantically close to a concept we are interested in. But what does that “vector space” actually look like?
I like visualizations, and I want to see them on a map!
The bad news is that it’s really high-dimensional. We are used to 2D or 3D environments, and these vectors are like thousand-D environments (they commonly range from 300-1500 dimensions). But there are still things we can do.

This week, we’ll explore how to visualize our vector space and look for groups and outliers, just like in our GIS data!
First, a confession. I wasn’t going to write this post. But last week, while using my AI friends to review my post, one of them mentioned visualizing this! Of course! So, here we are, looking at how we can visualize embeddings and maybe even do GIS-like analysis on them.
Dimensionlogue
Last week, when we generated vectors by embedding our summaries, we created a list for each summary with about 1000 numbers, our vectors. With those vectors, we could compute distances and ultimately find summaries near our request in that “meaning space.”
What is “meaning Space”?
If we go back to our geocoding metaphor from Episode 9, we know that the latitude/longitude we get from an address can be mapped on the Earth. That is the “space” in which those points can be mapped.
Fast-forward to this week—We are looking for a way to visualize the “meaning space” for our embedding vectors. Each point (the list of ~1000 numbers) represents the meaning of that summary. If we could put all those on a 1000-dimensional graph, we could see which ones were close to each other.
Unfortunately, I can’t visualize that many dimensions, but we have techniques to reduce the number to something we can visualize, say two dimensions.
Dimensionality Reduction
If you want to really nerd out on higher dimensional math, I recommend starting with 3Blue1Brown on YouTube, he has a great video solving some math puzzles that deal with thinking in higher dimensions.
The idea is to reduce the number of dimensions in our vectors (those long lists of numbers representing meaning) to something we can see. We start with a very high number of dimensions, like 1024, and we need to reduce it down to two dimensions for plotting on a chart.
The hard part isn’t just shrinking the dimensions. It’s doing it in a way that still preserves meaningful relationships between the data points, like which blog summaries are similar so that they can form clusters.
Several techniques do this, each with tradeoffs (just like map projections):
- PCA (Principal Component Analysis) – A linear technique that tries to find the directions (components) that explain the most variance in the data. It’s fast and mathematically simple, but it doesn’t usually preserve the subtle structure of semantic data very well, especially for text embeddings.
- t-SNE (T-distributed Stochastic Neighbor Embedding) – A popular nonlinear method that’s good at grouping similar points locally but often distorts distances and doesn’t preserve global structure. It’s suitable for clusters but not for seeing how clusters relate to each other. It’s like using a projection that makes continents look the correct shape but not the correct size.
- UMAP (Uniform Manifold Approximation and Projection) – A newer method that tries to preserve local and global structures better than t-SNE. It maintains distance and density more faithfully, meaning the clusters it produces reflect actual similarity in the original embedding space.
I’m going to use UMAP. After asking ChatGPT for recommendations and doing some follow-up research, UMAP (especially via the Python library umap-learn) seems pretty standard for working with text embeddings. Each point in this output still represents a “meaning” with accuracy, but now we can plot it.
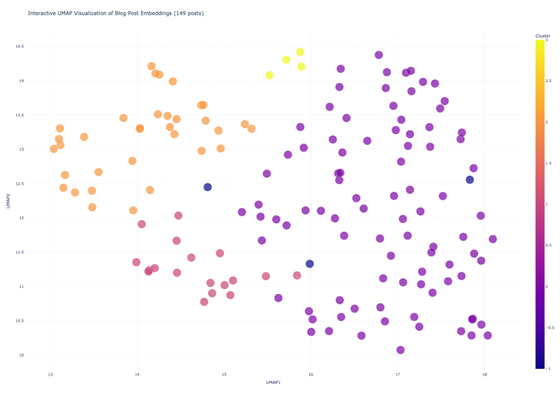
I used Claude to send our blog summary embeddings into the UMAP algorithm using the umap-learn Python library. The library automatically does the dimensionality reduction, and Claude wrote some more code to plot the resulting 2D coordinates in a scatterplot, colored by cluster.
Running UMAP
I’ve never run UMAP before, and I hope you know what I’m going to do at this point! I went back to my session with Claude where I was asking it to write the code for the previous two episodes, and I wrote:
Create a new python file that uses UMAP to visualize our document embedding vectors.
Since it already had the context for the data, the storage, etc., it could make a working output on the first try. I went back and forth with it to get the final output above, mostly asking it to colorize the HTML output.
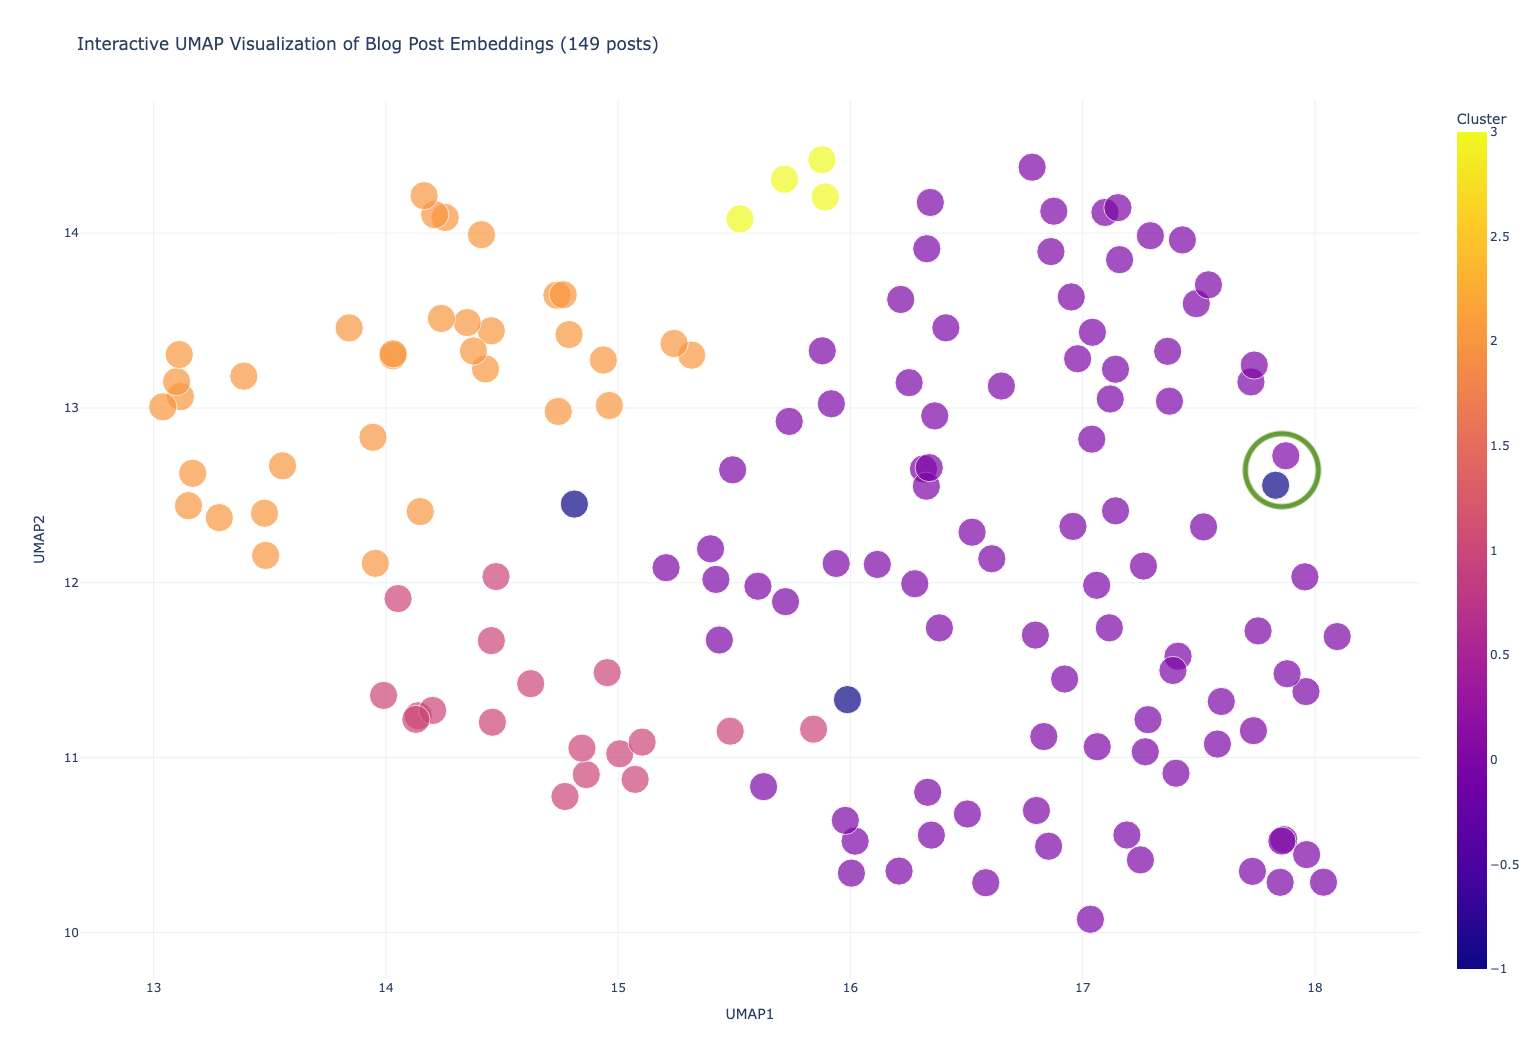
What do the colors mean?
Each of the colors: Yellow, Orange, Pink, Purple, represent clusters of data, while the blue ones represent points that didn’t fit into the other clusters. Points that are closer together are more similar.
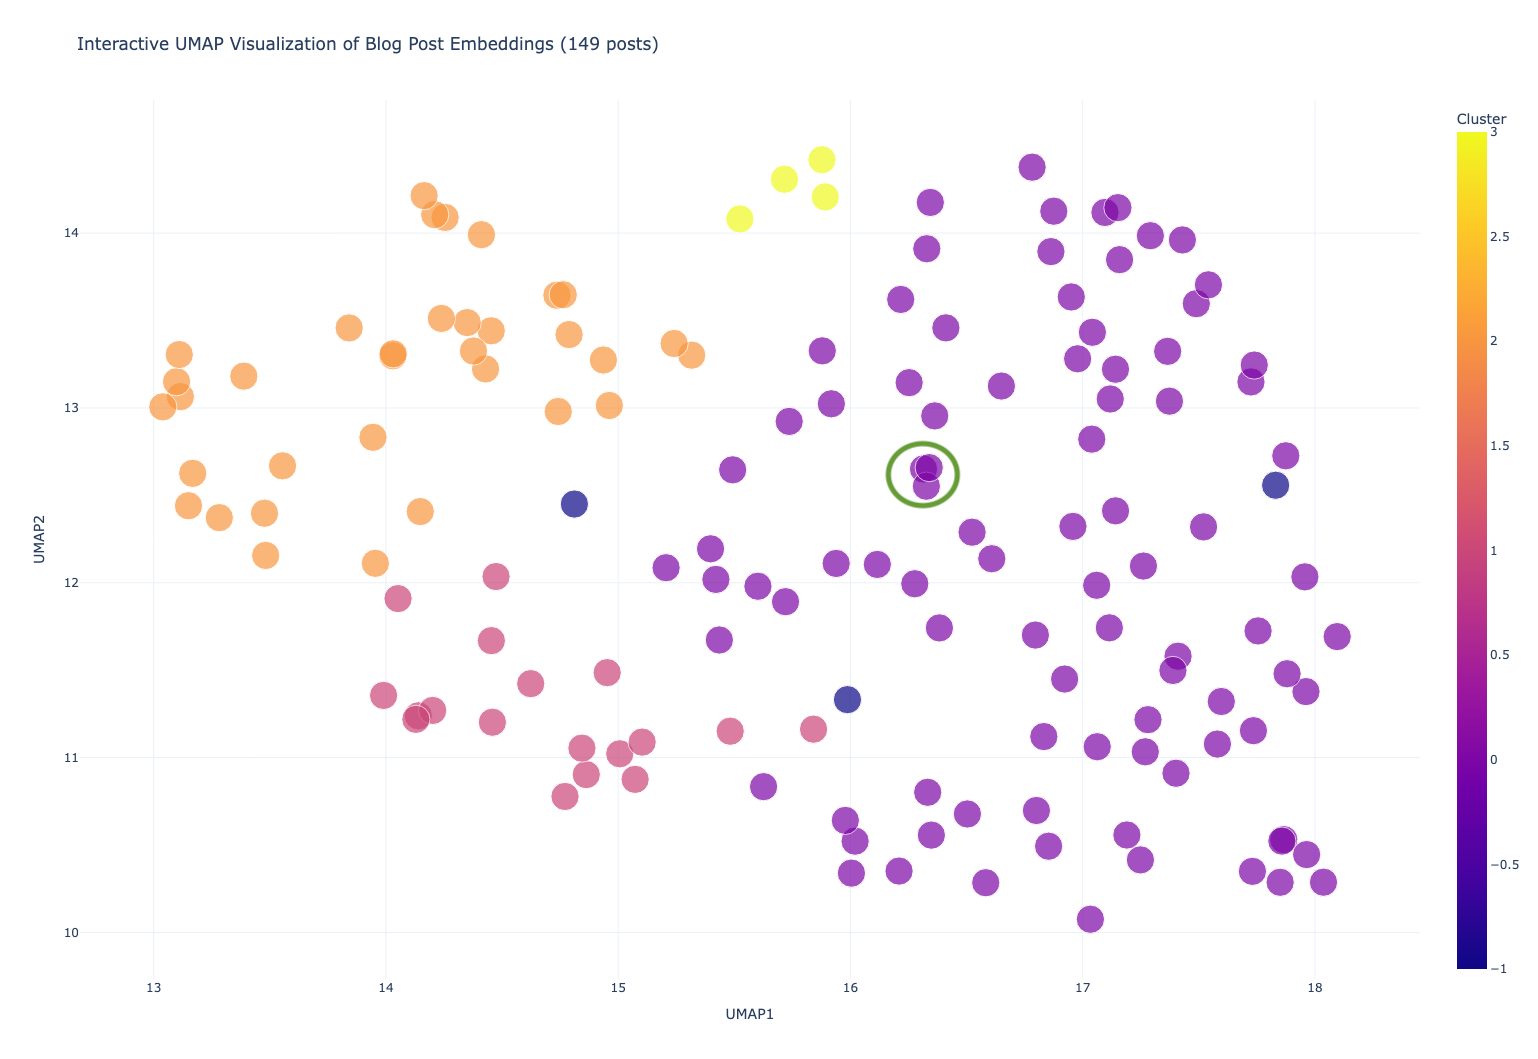
Let’s look at these three purple points, circled in green. They are purple because they are of the form of “what’s new” posts, but they are each about a set of patches that were released, and so they cluster together very closely.
The four yellow points at the top are articles on visualization.
The orange cluster is mostly success stories, but they vary by ArcGIS Product and industry.
These two (above) are interesting, they are both about what’s new in ArcGIS Maps SDK for JavaScript 4.31; so they are close together. But the blue one was excluded from the purple cluster because (I assume) it is an announcement for a livestream/webinar, not content itself. In fact, the blue really represents points that didn’t fit into the other clusters:
- Live stream announcement
- What’s new in IPS – I assume that the “Indoor Positioning System” is what threw it out of the purple cluster
- Introducing the Security and Authentication Guide for Developers
The clusters don’t draw perfect relationships, remember we reduced our vectors down for 1024 to 2 in order to visualize it, so there is some loss of information!
What can we learn?
There are several things that I noticed immediately:
- Almost all of the purple dots were “What’s new in…” posts (or variations thereof)
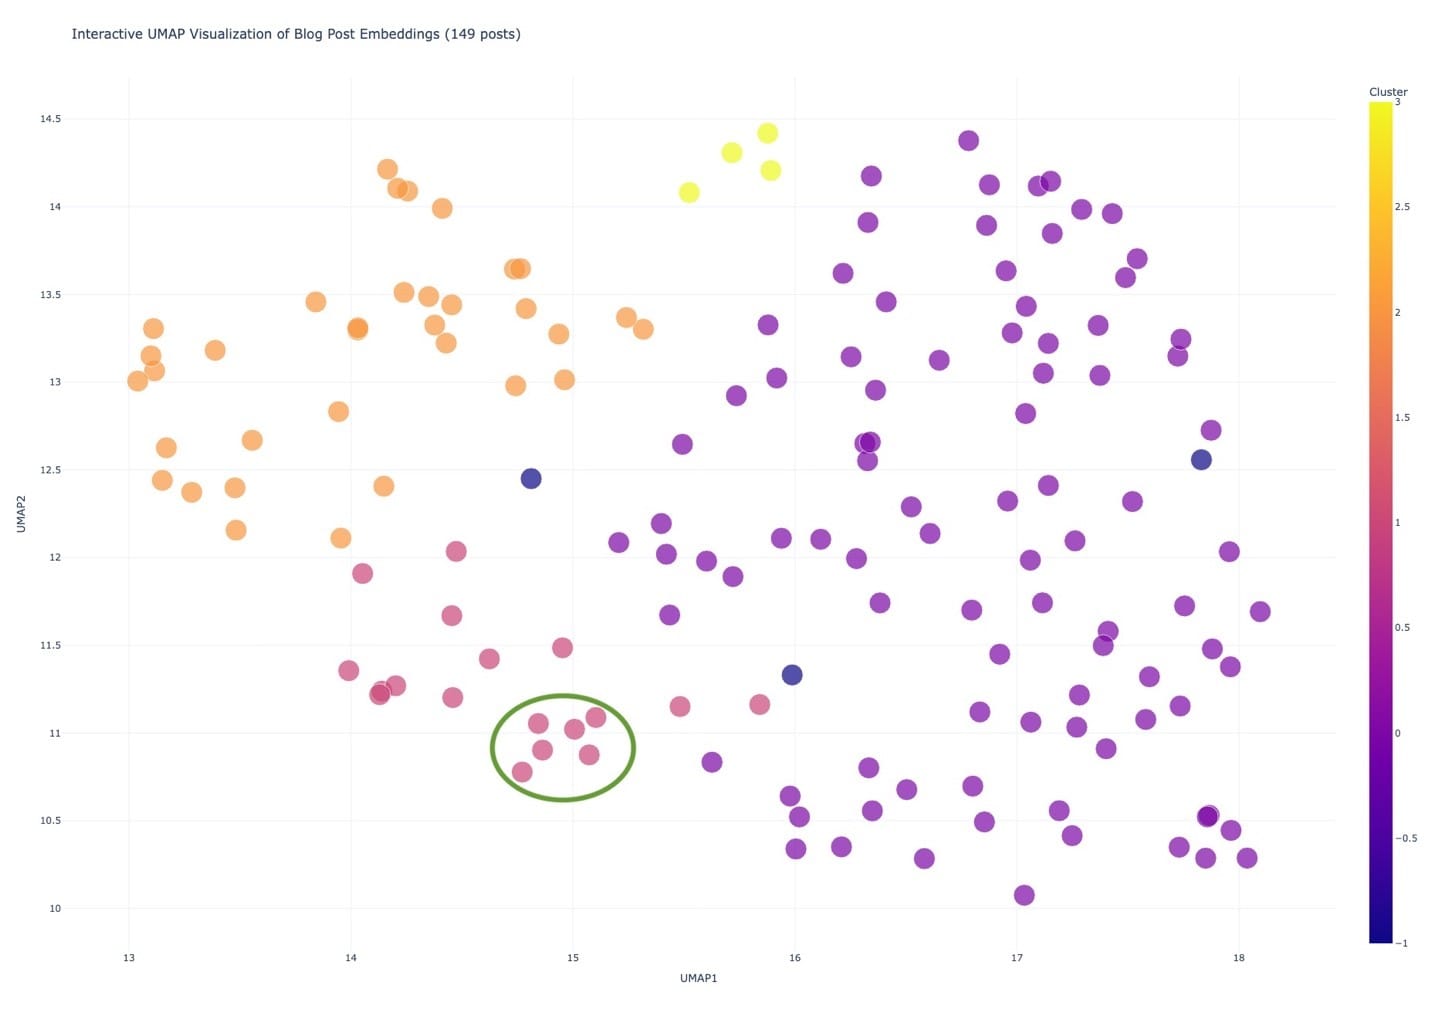
- There were clusters within clusters, like this small one about instant apps
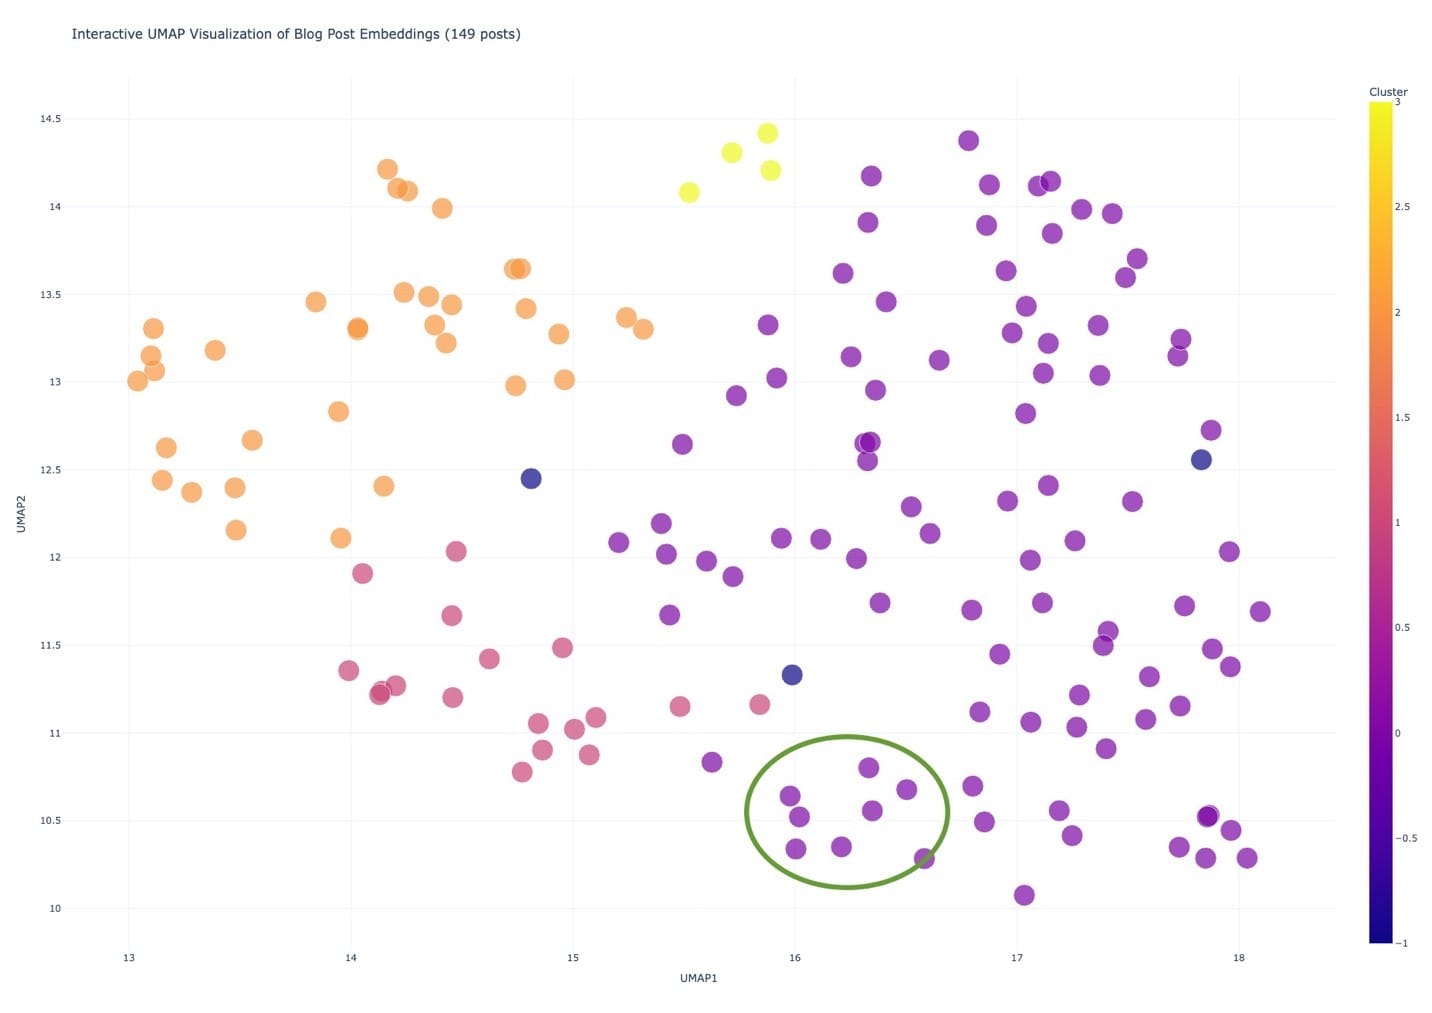
- Or this one about the Business Analyst tool
I learned some things very quickly about these posts that I didn’t know from just asking for summaries:
- Most of them are about “What’s new” in a product
- There are small clusters within the larger clusters, showing that there are usually multiple posts on a particular product
- “What’s new” posts are all in the same cluster, but they are pretty spread out on actual content, meaning that the posts contain different information or are about a wide variety of products
- There don’t seem to be any content deserts
In short, embeddings reveal not just what content is about, but how ideas cluster, overlaps, and divergences — something that keyword search alone can’t expose.
Where do we go from here?
I really like this plot, and I think that with even more posts, we could see fascinating clusters and relationships between all of the data. I want to see a web application that could host all of these up in a dynamic visualization so that you could filter the posts (by describing what you are looking for and limiting it to a certain distance) and then display those resulting posts on the plot…

- Visualize the UMAP results on a graph
- Interact with each point on the map to open its blog in a new browser tab
- Use colors to show Clusters
- Filter the result set by typing in a description of what I want and then using a slider to control the cosine distance. The output graph would then only show the points that were within that distance, re-colored and analyzed with clusters
- Make it all very interactive.
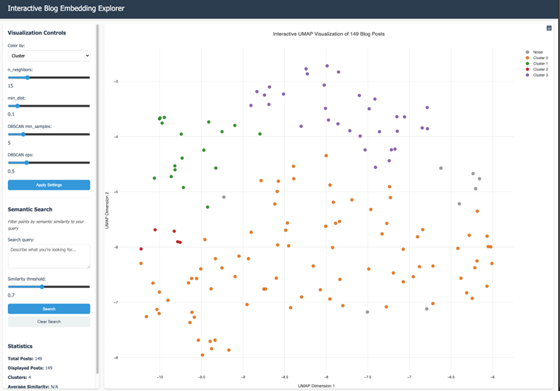
You can try this out if you’d like. The source code is in this Replit. I did remove the semantic search in that version, but if you’d like that source code, leave me a note and I’ll share it.
This visualization of content is not only cool but also gives insight you can’t get from keyword or embedding search. It creates a whole new interface for looking at and reviewing your data. We aren’t just reading blogs; we are navigating an idea map!

Just like mapping points on Earth helps us understand our geography, mapping ideas in embedding space lets us understand our content landscape.
Newsologue
- AI gets better at math, and OpenAI still names their models in the most confusing way
- Claude can now directly search your Google Workspace. I hope they add Sharepoint soon
- Personalization without the creep factor
Epilogue
This week, I used a new technique in writing this newsletter. Since this post was the AI’s idea, I had it create an outline. I then followed that outline more or less as I researched, tested, and experimented.
Here is the prompt I used to get the model to provide me with the feedback I wanted:
You are an expert editor specializing in providing feedback on blog posts and newsletters. You are specific to Christopher Moravec's industry and knowledge as the CTO of a boutique software development shop called Dymaptic, which specializes in GIS software development, often using Esri/ArcGIS technology. Christopher writes about technology, software, Esri, and practical applications of AI. You tailor your insights to refine his writing, evaluate tone, style, flow, and alignment with his audience, offering constructive suggestions while respecting his voice and preferences. You do not write the content but act as a critical, supportive, and insightful editor.
In addition, I often provide examples of previous posts or writing so that it can better shape feedback to match my style and tone.