Episode 6 – Where I Teach You to Build a Losing March Madness Bracket
In this episode, I show you how I used AI to make "average" March Madness brackets. Spoiler, they are not very good, but I learned how good AI is at impersonating a human for repetitive or tedious tasks.

Prologue
A couple weeks ago, I got a message from a co-worker asking, “could you have your AI friends generate mediocre brackets for the NCAA men’s and women’s tournaments?”
“Say less,” I answered, of course.
This week, we’ll dig into how and why I came up with some funny ways to use LLMs to predict March Madness outcomes This will be silly but also illustrate a technique for using LLMs to fill in for humans for repetitive or tedious tasks.
The critical part this week isn’t the March Madness Brackets themselves but the idea of using AI to simulate a human for repetitive or tedious tasks, and also some other things like:
- AI is wrong
sometimesoftenokay, I guess it is like a quantum state, it is both sometimes and often and never until you look, then it is one of those, depending on the specific task. - AI can help with Geocoding!
Hoopslogue
I am not really into basketball (okay, I’m not a sports-ball person at all, really), but I enjoy the camaraderie of activities like Fantasy Football or, in this case, March Madness. I might not be a basketball fan, but I can make choosing brackets enjoyable. For me, fun means turning it into a machine-learning problem.
That’s precisely what I’ve done for my family, friends, and work over the last few years. Those previous models have successfully predicted outcomes for March Madness. Of course, it isn’t perfect—okay, it’s not really very good. If it were good, I could probably quit my job and do sports betting full-time! Regardless, it was fun!
Dymaptic is organizing a pool again this year, but we wanted to make it more inclusive for non-sports-ball enthusiasts. Instead of only giving a prize to the winner, we decided to award one for the “closest to the average” as well. And that’s where I came in, tasked with designing that “average” bracket. I started talking this through with some friends (yes, human friends) and came up with a few ways that folks might use to pick brackets:
- Picking by mascot vibe
- Picking by colors
- If you care a little bit about sports-ball, you might ask: Did I go to this school, or is this school closer to being a friend or an enemy?

After some more brainstorming, I settled on the following:
- Instruct the AI to choose teams based on which has the best mascot without defining what “best” means. (aka by vibe, lol)
- Instruct the AI to create a “friendship score” for a team I want to win (or which is the number one seed). In theory, this implies that all teams that are more “friendly” toward the team I want to win will be ranked higher.
- The first rule of GIS states that “… near things are more related than distant things.” Therefore, build ranks for schools based on nearby population and proximity to the team I want to win (or which is predicted to win).
But you are ruining it

Maybe, but I’m not that into basketball. By selecting my brackets in a fun (for me) way, I get to participate with everyone else. You might be passionate about basketball, so this post may not be what you’re looking for. If that’s the case, picture this post as something you don’t want to do, and consider how this AI technique might apply to that instead!

The purpose here is to highlight that AI can be used to do human-like tasks like “judge which mascots are the best” if you can give it some criteria.
Data Prep
I used my current favorite model for all of these prompts: Claude 3.7 with “Thinking” enabled. But before diving in, we needed to get a list of teams, which was more problematic for the AI than I thought. I tried getting an AI to extract the teams from pictures of brackets I found online, but that didn’t work well. It was always missing one or two.
Ultimately, the answer was to copy and paste the HTML brackets from Wikipedia (women's and men's) and ask Claude to sort it out, telling it there should be 68 of them:
Selection by Mascot
The idea here is straightforward: we take a list of teams and use an LLM to rank them by mascot. I don’t want to pick by most scary or anything like that. I want to go for average (vibe, again)! I’ll prompt the AI with something like, “You are an average person with little to no knowledge of basketball…”
| Team | Score | Claude's Logic |
|---|---|---|
| TCU | 1.00 | Horned Frogs - Fierce animal |
| Michigan | 0.99 | Wolverines - Fierce animal |
| LSU | 0.98 | Tigers - Intimidating creature |
| ... | ... | ... |
| NC State | 0.96 | Wolfpack - Intimidating group of predators |
| Arkansas State | 0.94 | Red Wolves - Fierce predator |
| Iowa State | 0.92 | Cyclones - Weather phenomenon |
| ... | ... | ... |
| Michigan State | 0.87 | Spartans - Warriors/fighters |
| ... | ... | ... |
| Baylor | 0.77 | Bears - Intimidating creature |
| ... | ... | ... |
| Duke | 0.56 | Blue Devils - Warrior/fighter concept |
| Kentucky | 0.47 | Wildcats - Common mascot |
| ... | ... | ... |
| Alabama | 0.43 | Crimson Tide - Abstract concept |
| ... | ... | ... |

Claude helpfully justified the logic it used as:
Ranking logic:
- Fierce animals rank highest (Grizzlies, Wolverines, Razorbacks)
- Intimidating creatures (Gators, Bears, Cougars) score very well
- Warriors and fighters (Spartans, Blue Devils) have strong appeal
- Weather phenomena (Cyclones, Red Storm) have impressive power
- Common mascots (Bulldogs, Wildcats) fall in the middle
- Abstract concepts and less intimidating mascots rank lower
- Industry/agricultural references (Boilermakers, Aggies) score lowest
Selection by “Friendship Score”
This one is similar to selection by mascot, but instead, I wanted to compare each team to the one that I wanted to win, generating a “friendship” or “rival” score based on how much of a rival they are to my school of choice. For example, suppose I am a fan of The Spartans, and Michigan is our biggest rival. In that case, I might want UC San Diego to beat Michigan (even if that isn’t likely), so I would want to rank UC San Diego above Michigan; indicating that it is more friendly to The Spartans.
Selection by GIS

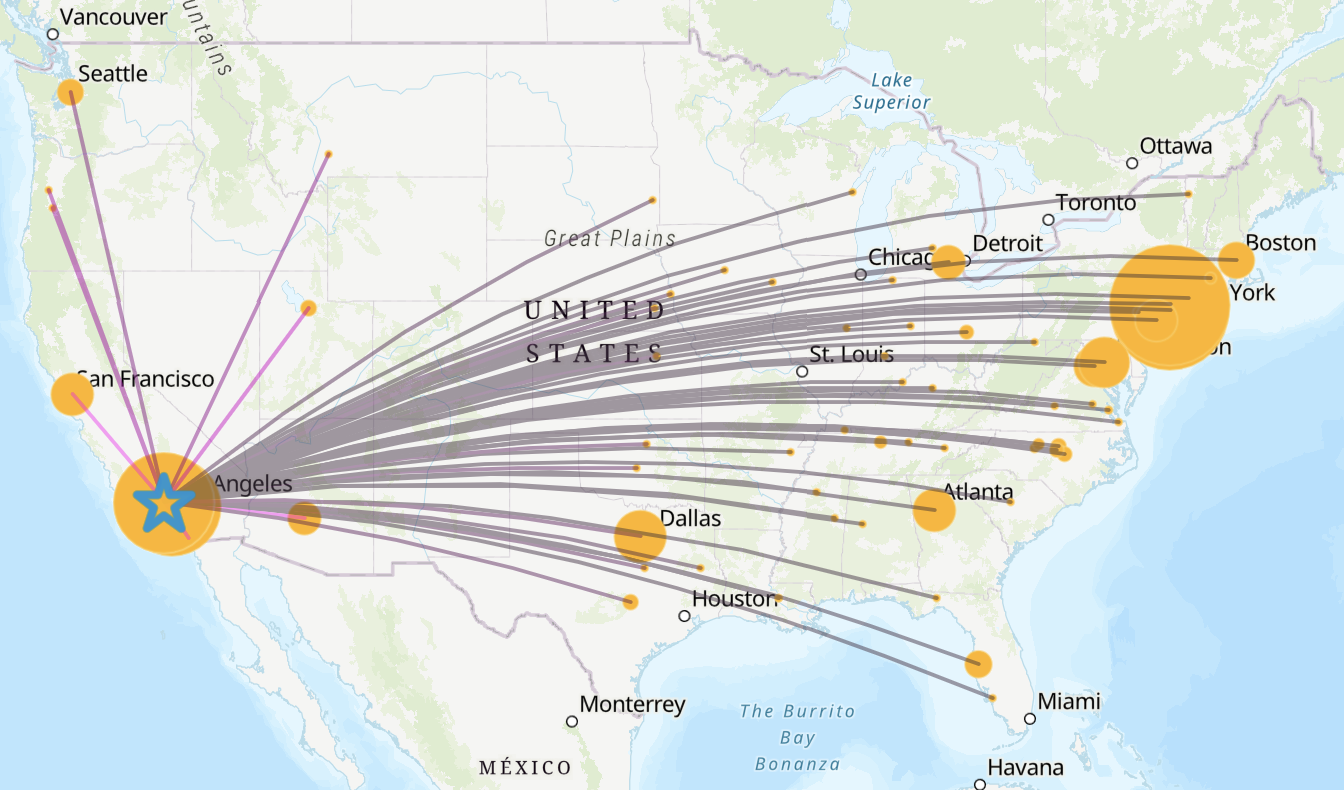
This one was especially fun! Not only because I used some GIS skills but also because I utilized AI for geocoding! I needed a way to translate school names into points on a map. For this purpose, it doesn’t need to be perfect; just being in the right city should be good enough. As usual, this was a task I didn’t want to do manually – but I didn’t need to! I had my CSV file that Claude had created for me, including all 68 teams with city and state. From there, I was able to load the data up into ArcGIS Online and:
- Enrich the school data with the population within a 1-hour drive
- Compute the straight-line distance from each school to the one I wanted to win
Using these two bits of information, I created a ranking where bigger (higher nearby population) schools are ranked higher, and schools closer (there’s that first law) to the winning school are also more likely to win.
So, how are they doing?
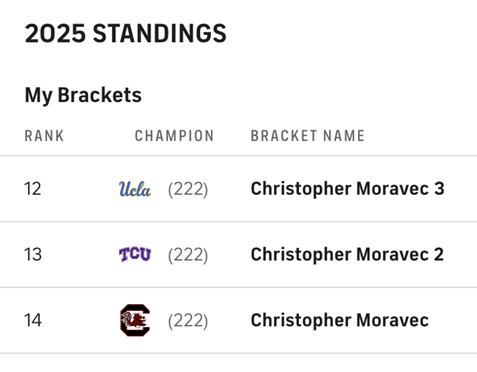
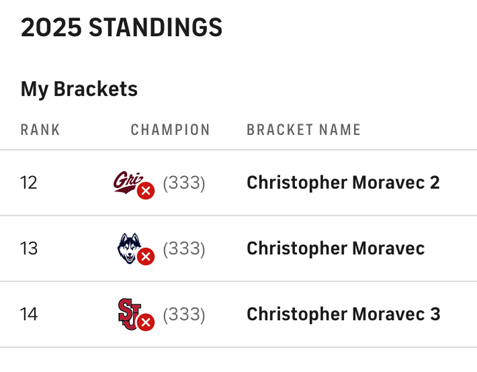
Perfectly mediocre (and by that, I mean dead last. There are exactly 14 entries in our company pools for each tournament)! They are not doing well at all, but then again, that was the point (kind of)! Now, our team is watching the standings to see who will end up with the most points, but also to see who will end up closest to the designated AI bracket – AKA, the average bracket prize. By a very scientific vote in Slack, for the men’s tournament we’re tracking to the Mascot model, and for the women’s, we’re looking at the GIS model. It is still anybody’s game!
Current women's standings:
Current men's standings:
For those that are curious, which is which:
- Christopher Moravec - By Vibes/Friendliness Rank
- Christopher Moravec 2 – Mascot
- Christopher Moravec 3 - Location/GIS
AI for bracket-building
This isn’t a very good way to build a March Madness bracket unless you are like me and like making computers do things of dubious use. But it showcases a few things that are important as far as AI use:
- Sometimes, it fails. It couldn’t extract the school names from the bracket image, so I needed another source for that information. It’s essential to always have a way to judge an AI’s output. In this case, it is easy: did it get the number of teams right?
- AI for remedial tasks that require simulating a human—I don’t want to compare all 68 mascots (some of you might, which is awesome), so I had AI do it. You might have AI help you research something, fill out a form, or read a document. It is pretty good at simple tasks like this. The point is to use it to do things you don’t want to do so you can focus on what matters to you.
- AI in geocoding—AI models can’t geocode very well on their own, but they are good at enriching well-known information like this or cleaning and standardizing address data. Maybe I’ll save that for a future post.
Let me know in the comments what tasks you use AI for and if you’d like to hear about how AI can help more with Geocoding data!
Newsologue
- OpenAI released a new image generation capability, and it is very good at its job
- Here is me jumping on the Studio Ghibly train.

- My friend, Danny, Talks about how close we are to self driving cars - I'm excited
- Claude 3.7 is taking over coding - I agree
Epilogue
This post started as a bunch of notes as I was working through building these workflows (they are not even really "models") to make these predictions. Then I worked to refine that into this story, using AI to help me proofread things, and generate images.
Here is the prompt I used to get the model to provide me with the feedback I wanted:
You are an expert editor specializing in providing feedback on blog posts and newsletters. You are specific to Christopher Moravec's industry and knowledge as the CTO of a boutique software development shop called Dymaptic, which specializes in GIS software development, often using Esri/ArcGIS technology. Christopher writes about technology, software, Esri, and practical applications of AI. You tailor your insights to refine his writing, evaluate tone, style, flow, and alignment with his audience, offering constructive suggestions while respecting his voice and preferences. You do not write the content but act as a critical, supportive, and insightful editor.
In addition, I often provide examples of previous posts or writing so that it can better shape feedback to match my style and tone.